What Does the Drivetrain Loss Calculator Do?
This tool calculates the numerical difference between a crank-power figure and a wheel-power figure. It reports the gap in horsepower and as a percentage of the crank value. Unlike the WHP estimator, it does not choose a loss assumption to infer a missing power figure: both numbers must already be supplied. That makes it useful for describing a pair of results without silently assuming a typical drivetrain percentage.
How to Use This Calculator
- Enter the known crank or engine power in mechanical horsepower. Use the same unit basis for both fields; convert PS or kW first if needed. The crank value must be positive so it can serve as the percentage denominator.
- Enter the wheel-power figure you want to compare. Record whether it came from the same vehicle, configuration and time period as the crank figure, because that affects the interpretation.
- Calculate the horsepower gap and percentage of crank power. A negative gap means the entered wheel value exceeds the entered crank value; review the evidence rather than assuming negative physical losses.
- Keep the two source figures with the result. If only one measurement is available, use the separate WHP-to-HP scenario tool instead of inventing a second measurement to produce a plausible percentage.
The Maths & Assumptions Behind the Tool
Power difference = crank hp − wheel hp. Percentage difference = power difference ÷ crank hp × 100. The denominator matters: 350 crank hp and 300 wheel hp differ by 50 hp, which is 14.29% of 350 but 16.67% of 300. This page reports the former because it describes the fraction of the entered crank figure absent from the entered wheel figure. It does not independently measure where the difference arose.
Worked example
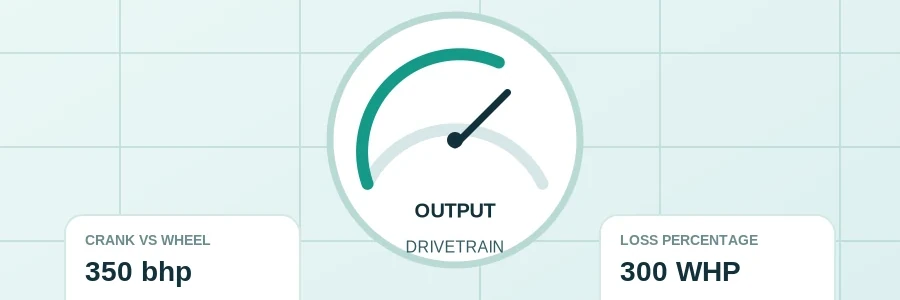
350 bhp at the crank and 300 WHP gives a 50 hp difference, or about 14.3% of the crank figure.
Why This Matters for UK Drivers
Check that both inputs use the same horsepower unit. A mechanical-hp value and a PS value need conversion before subtraction. Also establish where and how each figure was obtained. A manufacturer rating, a hub-dyno result and a tyre-on-roller result may have different measurement conditions. Arithmetic can compare them, but the output cannot explain how much of the gap comes from drivetrain friction, tyre losses, correction methods or differences in engine output.
A negative difference means the entered wheel figure is greater than the crank figure. The calculator can describe that relationship, but it should prompt an investigation of the inputs rather than a claim of negative mechanical losses. Repeatability matters when assessing modifications. Compare readings from a consistent test method and record the conditions. An apparently improved percentage caused by changing measurement methods is not proof that a component has become more efficient.
Interpreting the result in practice
For a repeatable comparison, match the measurement basis before interpreting the result. If one source uses metric horsepower and the other mechanical horsepower, a small numerical gap can arise purely from units. If a manufacturer rating describes a standard engine but the wheel test describes a modified car, the difference does not isolate the drivetrain. Dates, fuel, configuration and test conventions belong beside the numbers.
A percentage can also look more stable than an absolute gap when neither is established as constant. Real systems do not have to lose the same percentage at every speed and load. Calculating one paired value does not justify applying it to every point on a power curve. The tool performs a ratio at the entered point; it has no model of bearings, gear meshes, tyre deformation or accessory demand.
For UK buyers reading a dyno report, the useful question is often whether two figures are genuinely comparable. Preserve the report's labels and ask the supplier how an estimated flywheel figure was obtained. A derived crank estimate may already include a modelled allowance, so comparing it back with its own wheel measurement can simply reproduce the original assumption rather than add new evidence.
For another check, suppose crank output is entered as 200 hp and wheel output as 180 hp. The gap is 20 hp and the reported difference is 10% of crank output. Reconstructing the wheel value gives 200 multiplied by 0.90, or 180 hp. This verifies the percentage convention. It does not establish that every missing horsepower was dissipated in a specific mechanical component.
If both readings are rounded to the nearest ten horsepower, reporting their difference to several decimal places adds no measurement certainty. Keep the displayed precision in perspective and use the original test resolution when discussing small changes. A mathematically accurate percentage can still be based on approximate inputs.
Why call it a difference rather than a measured loss?
Crank and wheel figures may come from different test equipment, correction standards, temperatures or even different vehicle states. The arithmetic difference is clear; attributing every horsepower to drivetrain friction can overstate what the data proves.
Known only one figure?
If you know only WHP and want to explore assumed crank power, use the WHP-to-HP calculator where the loss percentage is an explicit adjustable assumption.