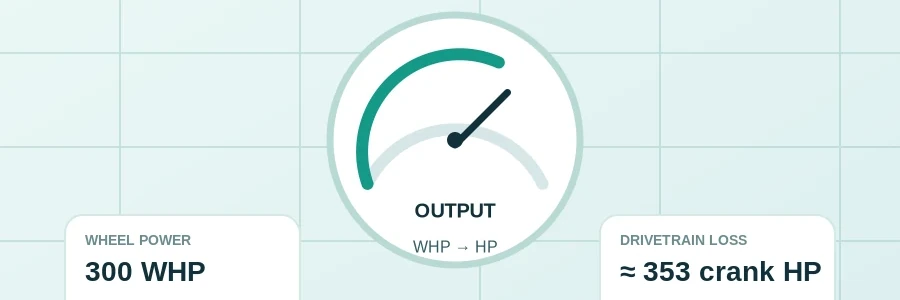
What Does the WHP to HP Calculator Do?
Wheel horsepower and crank horsepower refer to different measurement points. This calculator explores the relationship using an explicit percentage difference and also calculates an implied difference when both readings are known. It offers both directions because estimating crank power from a wheel reading requires division, whereas estimating wheel power from a crank figure requires multiplication. Simply adding a percentage to the wheel reading gives a different answer.
How to Use This Calculator
- Choose whether you are starting with wheel horsepower, starting with crank horsepower, or comparing a known pair. Check that all figures use the same horsepower unit before entering them.
- Enter the relevant power value and select a drivetrain-difference scenario. For a custom scenario, enter the percentage explicitly. It is a fraction of crank power, not a percentage to add directly to wheel power.
- For a known-pair comparison, enter both crank and wheel figures from compatible sources where possible. Note if one is a manufacturer rating and the other a measurement from a different date or vehicle state.
- Calculate and review the assumed or implied percentage beside the output. Compare more than one percentage if it is unknown, and retain the assumption when saving or sharing the result.
The Maths & Assumptions Behind the Tool
Wheel power = crank power × (1 − difference fraction). Rearranging gives crank power = wheel power ÷ (1 − difference fraction). Therefore 300 WHP at an assumed 15% difference implies 352.94 crank hp, not 345 hp. For a known pair, the numerical difference percentage is (crank − wheel) ÷ crank × 100. A 100% assumption cannot be used in the reverse formula because its denominator is zero.
Worked example
At 300 wheel horsepower and an assumed 15% difference, estimated crank horsepower is 300 ÷ 0.85 = 352.94 hp. Adding 15% to 300 would give 345 hp and would use the wrong base.
If crank and wheel readings are both known, 350 crank hp and 300 WHP imply (350 − 300) ÷ 350 × 100 = 14.29%. This compares the two readings; it does not establish a universal drivetrain-loss percentage. Comparable test conditions matter.
Why This Matters for UK Drivers
A percentage loss is a scenario, not a fixed property of front-, rear- or all-wheel drive. Test equipment, tyres, transmission conditions, temperatures and measurement conventions can influence the comparison. The sensitivity table helps show how strongly the estimated crank figure depends on the chosen percentage. A measured wheel-power result remains a wheel-power result; the inferred crank number should retain its assumption label when shared.
For the implied-difference mode, use readings that are genuinely comparable. A manufacturer's quoted net engine power and a wheel reading from a different condition or correction standard may not isolate mechanical drivetrain loss. If the wheel value exceeds the entered crank value, investigate the measurement basis rather than treating the result as a simple physical loss. This page is useful for understanding the numbers in a dyno discussion, but it cannot certify engine output or the effectiveness of a tuning change.
Interpreting the result in practice
The percentage basis is a common source of error. A 15% deduction from crank power is not undone by adding 15% to the lower wheel figure. The inverse must divide by 0.85. For a quick check, multiply the inferred crank output back by the retained fraction; it should reproduce the original wheel figure apart from rounding. That arithmetic check validates the rearrangement, not the assumed percentage.
Comparisons between dynamometer results need context. Tyres, temperatures, correction conventions, gear selection and test methods may affect reported values. An apparent difference between two charts is not automatically a measured transmission loss or a proven tuning gain. Keep original reports and their conditions together, and use compatible before-and-after measurements when evaluating an actual change. The calculator offers transparent scenarios, not a replacement for those records.
A wider sensitivity range can be more honest than one apparently exact crank figure. At 300 WHP, a 10% difference implies 333.33 crank hp, while a 20% difference implies 375 hp. Neither is established merely by knowing the wheel figure. Presenting both makes the effect of the unknown percentage visible and prevents the arithmetic's decimal places from disguising uncertainty.
If the aim is to compare a car before and after work on the same dynamometer, start with the comparable measured wheel outputs. Applying different assumed drivetrain percentages to the two runs can create or exaggerate an apparent engine-power gain. Explain any reason for changing the assumption and retain the original measurements. The calculator cannot validate a claimed improvement, but it can make that dependence easy to inspect.
Compare the sensitivity, not just one number
A modest change in the assumed drivetrain percentage can move the estimated crank figure significantly. The result therefore includes a sensitivity table so you can see 10–20% scenarios alongside your selected value.
What “implied loss” means
If you already know a crank figure and a wheel figure, the calculator can show the percentage difference between them. That does not prove the drivetrain physically consumed that exact percentage under every condition; it describes the relationship between the two entered numbers.