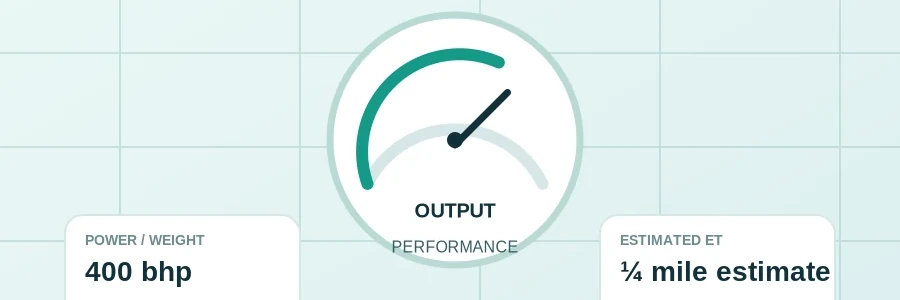
What Does the 0–60 & Quarter-Mile Scenario Calculator Do?
This page demonstrates how a simplified power-and-weight model responds to different inputs. It produces an illustrative quarter-mile time, trap speed and broad 0–60 scenario range. Those outputs are not validated predictions for a particular car. Their purpose is to make the assumptions behind a rough performance estimate visible and show why a change in one input need not produce an equally large change in elapsed time.
How to Use This Calculator
- Enter engine power in mechanical horsepower and vehicle mass in kilograms. Include the driver and load if those belong to your scenario. Do not silently mix wheel horsepower with a crank-power assumption.
- Select the launch factor to explore. The three factors are 1.08, 1.00 and 0.93. Their labels describe illustrative directions of change; the tool has not calibrated them to your tyres, transmission or vehicle.
- Calculate and read the modelled quarter-mile time, trap speed and 0–60 spread together. None is a measured result. The spread is a fixed display range rather than a probability statement.
- Change power, mass or factor individually to understand the model's sensitivity. Use published test conditions or controlled measured evidence when you need a claim about a specific car's actual performance.
The Maths & Assumptions Behind the Tool
Weight in pounds is kilograms multiplied by 2.2046226218. Quarter-mile time = 5.825 × cube root(weight pounds ÷ hp) × launch factor. Trap mph = 234 × cube root(hp ÷ weight pounds) ÷ square root(launch factor). For 0–60, R is hp per tonne: central seconds = maximum of 2.1 and [6.6 × square root(150 ÷ maximum(R, 20)) × factor]. The displayed spread is 0.90 to 1.12 times central seconds. These constants and bounds are illustrative and unvalidated for your vehicle.
Worked example
For 400 mechanical hp, 1,600 kg and the neutral factor 1.00, the model gives approximately 12.03 seconds for the quarter mile and 113.26 mph trap speed. The separate 0–60 expression gives a central 5.11 seconds and a displayed illustrative spread of about 4.60–5.73 seconds.
These numbers are outputs of the disclosed equations, not a forecast or a measured result. The spread has no statistical confidence meaning.
Why This Matters for UK Drivers
Power should be mechanical horsepower at the crank and mass should represent the vehicle in the scenario, including any relevant load. The assumption factor adjusts the model and is not a measured traction coefficient. Selecting a favourable factor does not establish that the tyres, surface or drivetrain can achieve it. The range displayed around the 0–60 scenario is a chosen spread, not a confidence interval derived from vehicle tests.
Use a manufacturer specification or a controlled measured result when comparing actual acceleration. Launch method, gearing, tyres, road gradient, weather and drag can move real performance far from this simplified output. Do not use it to set up a public-road acceleration test or to claim a modification delivers a guaranteed time. If a performance claim depends on this page agreeing to a tenth of a second, the evidence is insufficient; better measurements are needed.
Interpreting the result in practice
The cube-root relationships intentionally make power increases produce smaller proportional time changes. Doubling power does not halve the modelled quarter-mile time: it multiplies time by the cube root of one half, about 0.794. The model has no explicit traction limit in that quarter-mile equation and does not compute aerodynamic drag, shifting or gearing. A plausible-looking result can therefore still be wrong for a particular vehicle.
The 0–60 relationship is a separate illustration, not a derivation from the quarter-mile result. Its imposed 2.1-second floor and 20 hp-per-tonne denominator bound are mathematical choices. They are not physical limits or evidence about road-car capabilities. The 90–112% spread is likewise chosen rather than estimated from a validated error distribution. Treating it as a confidence interval would imply evidence this tool does not have.
For a meaningful real comparison, ask whether tests include rollout, the same surface, similar load and consistent conditions. A manufacturer's published claim and an independent timed run may use different methods. This calculator cannot reconcile those differences. Its limited purpose is to make the effect of assumed power and mass visible, with every equation disclosed, without claiming to certify a performance figure.
A sensible sensitivity exercise begins with a baseline and changes only one variable. Increase power by a stated amount while holding mass and launch factor fixed, then restore power and change mass. This identifies what the equations themselves imply. Changing all three at once can produce an attractive number without showing which assumption drove it. Keep each scenario labelled and avoid presenting its output as a tested capability or using it to justify unsafe road testing.
Use measured performance for vehicle claims
A timed result depends on the test method and conditions. This model is not a simulation of tyre grip, gear changes, a power curve or aerodynamic resistance. Use it to explore arithmetic sensitivity, and use a controlled measured test or a stated manufacturer specification for a claim about an actual vehicle.